
What is WaveDrom?
Imagine a world where creating intricate digital timing diagrams is as easy as pie! WaveDrom is an open-source tool that allows you to visualize the states and transitions of signals in your digital circuits with just a few lines of code. Whether you’re designing VLSI circuits, working on embedded systems, or delving into chip design, WaveDrom is here to simplify your life!
Why WaveDrom?
1. Simplicity at Its Best!
WaveDrom’s syntax is user-friendly and intuitive. Gone are the days of struggling with complex software interfaces! With WaveDrom, you can quickly define signals, their states, and the timing characteristics in a straightforward, JavaScript-like language. It’s so simple that you’ll wonder how you ever lived without it!
2. Real-Time Visualization!
The magic doesn’t stop there! WaveDrom lets you see your diagrams come to life instantly. Modify your code, hit refresh, and voilà! Your updated timing diagram is rendered as high-quality SVG graphics right before your eyes. No more waiting for tedious rendering processes!
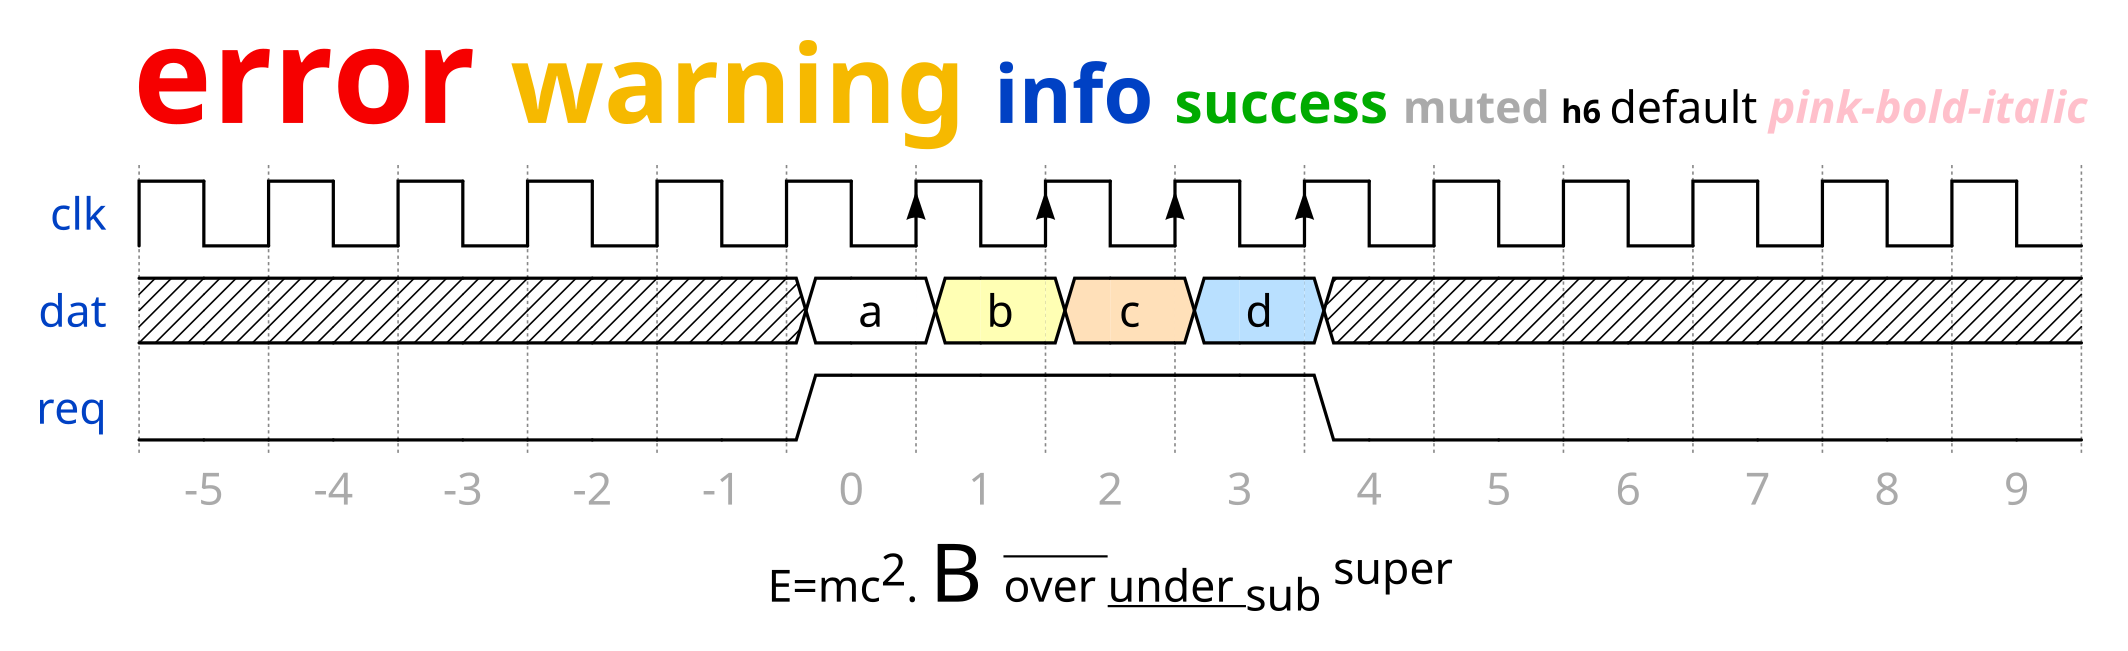
3. High-Quality Graphics!
WaveDrom outputs stunning, scalable vector graphics (SVG), ensuring that your diagrams look crisp and professional in any documentation. Whether you’re sharing with colleagues or presenting at a conference, your diagrams will impress everyone!
4. Open-Source and Community-Driven!
As an open-source tool, WaveDrom is continuously improved and supported by a vibrant community of users and developers. You can contribute, collaborate, and share your creations, making it a fantastic resource for learning and growth in the digital design community.